When we talk about the “protection gap”, we are usually thinking about natural disasters like floods and earthquakes where losses are insurable through existing insurance products, but significantly uninsured or underinsured due to low take-up rates on expensive policies, large deductibles and/or low limits. Big natural disasters also can cause losses falling outside of insurance coverage due to diffuse or indirect knock-on effects such as damage to public infrastructure, environmental contamination, reduction in general commercial activity during evacuation and recovery, or even longer-term job losses and population displacement or migration. Commentary following a large natural disaster often includes an estimate of overall “economic losses” as well as a typically much smaller number for insured losses1; the (uninsured) difference between them is the protection gap.
One of the biggest sources of those uncovered economic losses is typically business interruption, especially indirect or contingent business interruption which might be caused by disrupted suppliers, but also broader causes like power outages, transportation problems, booking cancellations in the tourism industry, or even more broadly reduction in spending from customers who have evacuated or are preoccupied by recovery, etc. Business interruption as a source of losses is not unique to “insurable events” like natural disasters, and I will contend that business interruption in the form of Systemic Dependency Risk has the potential to create massive economic losses while falling almost entirely outside of existing insurance product coverage – potentially the largest protection gap of all.
The insurance industry has offered business interruption coverage for more than two centuries under traditional property insurance policies and more recently under cyber insurance policies (“systems failure” coverage)2. But it’s an awkward fit: business interruption under a property insurance policy generally triggers only if caused by covered property damage to the policyholder’s facilities, or in the case of contingent business interruption coverage (as well as ingress/egress and civil authority order clauses), property damage to a third party asset that would have been covered had the asset belonged to the policyholder. The September 11 terrorist attack and the COVID-19 pandemic provided great examples of business interruption claims under property insurance policies providing uncertain coverage when events fall at the margins of the scope contemplated by policy wordings3. Uncertainty of coverage is not good for either the insurer or the insured, and can result in costly litigation.
It’s also worth noting that contingent business interruption coverage in property insurance policies – especially after Hurricane Katrina in 2006 – is generally not common anymore and tends to be quite expensive and/or limited.
Similarly, business interruption under a cyber insurance policy’s systems failure coverage is limited to covered events under that policy such as ransomware, data breach, denial of service attack, etc. that cause the interruption to the policyholder’s systems, or under dependent systems failure coverage to a third-party systems provider’s services. Cyber insurance policies do not cover contingent business interruption arising from a cyber event disrupting any other types of third-party suppliers (for example, makers of cream cheese-based products facing a shortage in 2021 due to a ransomware attack at one of the country’s largest dairy products producers)4. Dependent systems failure coverage under cyber policies has become increasingly subject to smaller sub-limits and exclusions for third-parties that pose portfolio-wide risks, such as cloud computing providers and internet service providers.
That said, just because business interruption is an awkward fit under traditional insurance policies doesn’t mean Systemic Dependency Risk can’t be insured. Where demand is acute and if the risk can be understood and doesn’t violate fundamental principles of insurance, the insurance industry has a reasonable track-record of creating new products – for example, the evolution of cyber risk insurance policies over the past three decades – and there have been some attempts in the broader business interruption insurance space such as for pandemics, cloud computing outages, and trade disruption, albeit with limited capacity and/or high cost.
So what makes Systemic Dependency Risk so difficult for insurers? Two very fundamental challenges: underwriting and capacity.
Underwriting
For established risks with high annual claims volumes and some degree of homogeneity across insureds, underwriters can look to loss cost histories to assess both expected profitability and risk of losses in relation to premiums. This works well for insurance lines like workers compensation, commercial auto, etc. but that’s obviously not going to work for Systemic Dependency Risk. When faced with low probability but potentially large losses, sparse loss histories and significantly different risk profiles amongst insureds – for example, natural disaster risk in property insurance, cyber risk insurance, etc. – more complicated underwriting analysis is required. Typically underwriters and actuaries break this up into two components: frequency and severity, which combined can provide an expected loss cost as well as a means of modeling the risk of very large losses both for individual policy risks and across a portfolio for accumulating risks.
The frequency component for Systemic Dependency Risk may be somewhat daunting for underwriters given the lack of historical data. This is particularly true when considering the full universe of dependencies to which an individual insured might be exposed, which could be quite opaque to a potential insurer no matter how thorough the application questions and submission information. However, one could imagine underwriters wrapping their minds around the frequency component for a collection of specific dependencies, especially where there’s scalability if those dependencies are shared across multiple insureds. A reasonable analogy would be earthquake risk, where models consider a large number of source faults and magnitudes with different occurrence rates informed by a limited history augmented by seismology. Any given insured is exposed to some subset of those potential earthquakes, and underwriters are able to get comfortable with the modeled expected loss cost due to earthquakes as one component of the “technical premium” to inform pricing, as well as the probabilistic portfolio-wide modeled losses for earthquakes affecting many policies.
Unfortunately, loss severity for business interruption risks is a much different animal. For property insurance, the property damage component of loss severity is well-understood and informed by historical experience – there have been lots of fires, earthquakes, hurricanes, etc. which have happened to lots of different types of buildings with different construction characteristics. Consequently, the business interruption component of loss severity for downtime as a result of property damage is also reasonably well-understood and informed by historical experience. At some level, the impact of losing the production or sales volumes of a damaged facility is fairly straightforward5, though perhaps somewhat more unevenly dependent on individual insureds’ business models and their mitigation and recovery practices.
But business interruption for Systemic Dependency Risk is a lot more complicated. Depending on the nature of the dependency, the scope of disruption can be one or more business units or even the entire business, rather than individual locations. The business may be able to at least mitigate some types of disruption with inventory stockpiles, redundancies, outage runbooks, etc. And the underlying business model matters – for example, are disrupted sales lost forever (e.g. airline seats6), or can disrupted sales be deferred and recovered when the disruption is over?
While the complexity of potential dependency disruptions should be well understood by the company’s risk managers and other senior leaders, the challenge for an underwriter – in the absence of a long history for very similar companies experiencing such disruptions – is the enormous amount of information and analysis it would take to gain a similar understanding. This information asymmetry between insured and insurer is a big problem if the gap is too wide: the underwriter can’t give every applicant the benefit of the doubt or they’ll lose money, so they have to price at average or below average relative to the information available. But if the difference between the price they quote and the “fair” price for less risky companies is too steep, those less risky companies won’t buy the policy and the pool of insureds will be differentially likely to be more risky companies (i.e. adverse selection), leading to a downward spiral of higher prices and fewer insureds where the underwriter cannot break even.
In addition to frequency and severity, the underwriter has to set a premium to cover administrative and distribution costs, as well as an adequate return on capital… and this may be a capital-intensive risk, which brings us to the problem of capacity.
Capacity
It’s no secret that the insurance industry doesn’t like large accumulation risks, meaning a single event that can cause losses across many policies – often both personal and commercial lines – such as hurricanes, earthquakes and floods. This aversion manifests in commercial insurance as exclusions, higher deductibles and sub-limits. For example, in property insurance it’s fairly common to see “named storm” (i.e. hurricane) or “movement of earth” (i.e. earthquake) subject to higher site deductibles, as well as policy-level per occurrence deductibles, lower per occurrence limits and annual aggregate limits. In a big disaster, an insured might both retain much more loss before the insurance policy pays out and also have losses exceeding limits in the biggest events. In cyber risk insurance, the possibility that a single point of failure such as a cloud computing or internet service provider could accumulate losses across huge swathes of policyholders has resulted in the exclusions and low sub-limits on dependent systems failure coverage discussed above.
Why is the insurance industry so allergic to large accumulation risks? Simple: the industry is just not very big. In the “classic” business model of insurance, the risk that any given policy has a loss – which might be a very risky large loss from the policyholder’s perspective – is unrelated to that of another policy, such that across a large portfolio of policies the frequency and overall severity of losses becomes fairly stable for the insurer. In this case, the insurer holds capital above and beyond reserves to cover random variability in the overall frequency and severity of loss (often called “process risk”, or perhaps “bad luck”) as well as the risk of underpricing, parameter misestimation or the effect of underlying latent variables driving frequency or severity. With large accumulation risks, the insurer needs to hold capital against the potential severity of one or more extreme events up to some threshold of acceptably low probability of occurrence.
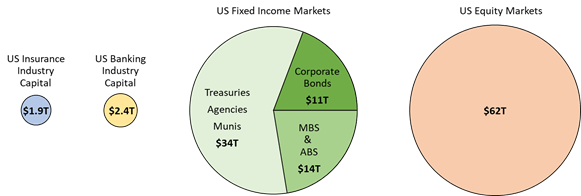
So how much capital does the insurance industry have? This is surprisingly a little difficult to answer because of all of the different channels through which risk flows into wholesale, reinsurance and even capital markets. Further, many insurers have particular geographic, market segment and/or product line specializations, and many reinsurers have global scope, often spanning primary, specialty and re- insurance, and sometimes both life/health insurance and property & casualty insurance, so a precise estimate of how much insurance industry capital there is might need to be constructed in relation to what type of loss you’re interested in. But just to put some rough numbers on it for the US, the National Association of Insurance Commissioners reported an aggregate policyholder surplus of $1.138 trillion for all US property & casualty insurers as of June 30, 2024. Lloyd’s of London adds approximately $60 billion, though much of that is in members’ funds specific to the syndicates those members support, each of which may have different geographic and product line scope. Estimates of total global reinsurance capital for 2024 range from $515 billion to $655 billion, with as much as $115 billion of additional alternative capital. So, let’s say that total US re/insurance industry capital is roughly $1.9 trillion, which may be a bit generous.
$1.9 trillion sounds like a lot of capital… until you consider the potential size of a major California earthquake or Florida hurricane may be over $300 billion at a 1-in-100 year probability threshold7, representing more than 15% of that capital. Of course, insured losses are much less than overall economic losses (especially for California earthquakes because the fraction of households with earthquake insurance coverage is in the teens), so the industry is not actually putting that much of its capital at risk for a 1-in-100 year natural disaster. Indeed, Aon’s 2021 Catastrophe Risk Tolerance Study showed that insurers’ disclosed 1-in-100 and 1-in-250 losses8 measured as a percentage of shareholder equity are typically in the 5% to 10% range, with a handful of extremes in the 20%-30% range for 1-in-250 losses. Also bear in mind that well-rated insurers are expected to be able to pay losses in extreme events of at least a 1-in-250 year return period level(and as a reminder, events at that level of improbability can be quite extreme)9.
And this is exactly the loss accumulation vs. capacity problem for Systemic Dependency Risk: it is not hard to imagine loss scenarios causing hundreds of billions in business interruption losses. In aggregate, the Fortune 500 had $19.9 trillion in annual revenues in 2024, so an event impacting 20% of the Fortune 500 for 20 days would be about $220 billion of disrupted revenues. Those 500 companies accounted for 49% of the revenues of approximately 21 thousand US companies with more than 500 employees in 2022, and while you might suppose that small- and medium-sized companies would be less likely to be exposed to Systemic Dependency Risk, it’s easy to imagine this segment contributing enough loss to put the total disrupted revenue well over $300 billion in such a scenario. At that order of magnitude, some insurers might perhaps be willing to dabble in this space, but the insurance industry overall is not going to be able to provide a meaningful solution to Systemic Dependency Risk.
Where does Systemic Dependency Risk belong?
Of course, the insurance industry isn’t the only capacity for absorbing risk in the economy. The US banking industry’s capital is only somewhat bigger at $2.4 trillion, with which it takes on large amounts of credit risk exposed to underlying systemic elements like real estate prices, or general economic conditions in particular industries, regions, or economy-wide… and potentially including Systemic Dependency Risk that could accumulate across a portfolio of borrowers. Capital markets are more than an order of magnitude bigger both in terms of capital and risk exposure10. The figure below provides a to-scale illustration of the risk-bearing capacity of insurance in relation to banking and capital markets.
Capital markets have already stepped in to fill some of the gap left by the insurance industry’s limited appetite for accumulations of natural disaster risk, to the tune of almost $50 billion of catastrophe bonds outstanding at year-end 2024. Cat bonds found a home in fixed income markets where relatively high interest spreads relative to the low probability risk of extreme events triggering loss of principal and lack of correlation to other asset classes made them attractive. Systemic Dependency Risk wouldn’t have that same lack of correlation to other asset classes, but the overlap with risks already embedded in corporate bonds and equity markets11, and the risk management skills and financial instruments available to participants in those markets, suggests there may be a home for it too in capital markets.
A capital markets-based solution for Systemic Dependency Risk would still suffer from the problem of underwriting the severity aspect, as discussed above. This likely then suggests a parametric insurance trigger based on an observable disruption event for a specific source of dependency risk, with the insured responsible to determine how much limit is appropriate for their own specific risk profile in terms of business model and risk mitigations. On the positive side, capital markets would be ideally suited to handle the frequency aspect of underwriting, with the market price of coverage reflecting expected failure frequency for a given dependency plus a risk premium for correlation and concentration risks.
While capital markets potentially offer some future hope for making Systemic Dependency Risk broadly insurable, that’s more or less science fiction for now. Until such time, companies will need to self-underwrite: identifying dependencies and estimating failure frequencies, working through dependency failure scenarios to determine potential loss severity, and then “pricing” the cost of that risk in order to prioritize which dependencies need to be addressed and to make cost-benefit decisions between potential mitigation options.
- For example, Hurricane Ian in 2022 caused approximately $110 billion economic losses and $60 billion insured losses. A variety of sources track insured vs economic losses by event or annual aggregates. ↩︎
- There are other specialty policies that include coverage akin to business interruption such as event cancellation insurance, delayed start-up coverage under construction insurance policies, and stock throughput policies with selling price valuation and/or delay coverage. ↩︎
- Businesses operating in the World Trade Center or its vicinity were generally covered for business interruption in the September 11 attack due to direct physical damage or under civil authority clauses when lower Manhattan was evacuated and closed to traffic. However, widespread disruptions caused by the FAA’s ground-stop order and the more prolonged closure of Reagan National Airport – particularly for hotels, airlines and airport services companies – were generally ruled not covered under civil authority clauses because of the indirect linkage between the property damage and the ground-stop order in fear of further attacks. Coverage for COVID-19 business interruption – a staggering sum in aggregate, potentially well over $10 trillion – has varied based on policy wording and jurisdiction, but most US courts have ruled that the virus does not constitute physical damage to trigger business interruption coverage under property insurance. Some courts also determined that stay-at-home orders and broad business category closures don’t trigger civil authority clauses because they arose from the threat of person-to-person contagion rather than viral contamination of specific locations, and anyway wouldn’t pertain if the order doesn’t prohibit access specifically to the policyholder’s premises. UK courts generally took a more policyholder-favorable view. ↩︎
- Insurers may be avoiding broader cyber contingent business interruption coverage due to potential for “risk creep” and portfolio loss accumulation. ↩︎
- Not to minimize the challenge of appropriately allocating business interruption values to individual facilities in insureds’ Schedule Of Values submitted to insurers, nor the modeling challenge of internal value chains across multiple facilities that can create either/all conditions for business interruption. ↩︎
- Even if the passenger’s flight is re-booked to a later date, that displaces a future saleable seat. Airlines have significant variable costs like jet fuel, but the majority are essentially fixed costs like the cost and financing of aircraft, employee salaries, gate slot rental, etc. which are incurred even when planes are idle. ↩︎
- The major catastrophe risk modeling firms’ industry loss exceedance probability curves are proprietary, but for order of magnitude and discussion see the following examples:
* Munich Re’s 2018 commentary on the risk of a very severe California earthquake,
* Karen Clark & Company’s 2018 analysis of the financial vulnerability of Florida’s insurance market in relation to very severe hurricanes, and
* Verisk’s 2024 report containing multi-peril modeled loss curves (Note that Tables 1 and 2 report annual aggregate losses, so the 1-in-20, 1-in-100 and 1-in-250 values partially reflect average annual losses from smaller events across all perils, plus one or more significant events for higher risk perils. Also note that these reflect only insured losses, with subsequent analysis in Figure 4 suggesting overall economic losses – insured + uninsured – almost twice as much for North America.) ↩︎ - “Probable Maximum Loss” or PML, which may be the worst oxymoron in risk jargon. ↩︎
- Or equivalently, multiple large but less-extreme events in a single year which in aggregate reach the same improbability threshold. Also note that insurers ability to conduct ongoing business after an extreme event may also depend on their post-event financial strength ratings and regulatory capital ratios, so running too big a risk of an extreme loss relative to capital can create the further risk that raising enough replacement capital could be quite challenging. ↩︎
- Albeit with some overlaps, as equity markets include publicly-traded insurance and bank equity, and bank and insurance companies’ balance sheets contain significant portions of investment securities. ↩︎
- Business interruption from a Systemic Dependency Risk event could manifest as increased default risk for corporate bonds as well as a hit to profits and potential longer-term business model consequences for equities. Additionally, for a dependency triggered by the failure a specific company, that company’s equity and bonds could also be at risk. ↩︎

Leave a comment